Free
- Open source and free to use.
- Constribute with code
- ...or join the discussion
- ...or sponsor Sevgi or buy me a coffee it allows me to keep working on it!
SVG Export
- Export your designs as SVG files.
- Perfect for laser cutting
- A great starter for patterns and logo design
Node-based
- Visual programming with a node-based interface.
- Non destructive editing.
Getting Started
Sevgi is different. Rather than drawing on a canvas, you define shapes using a graph of nodes. A graph is a network of elements with connections between them. We call those elements nodes.

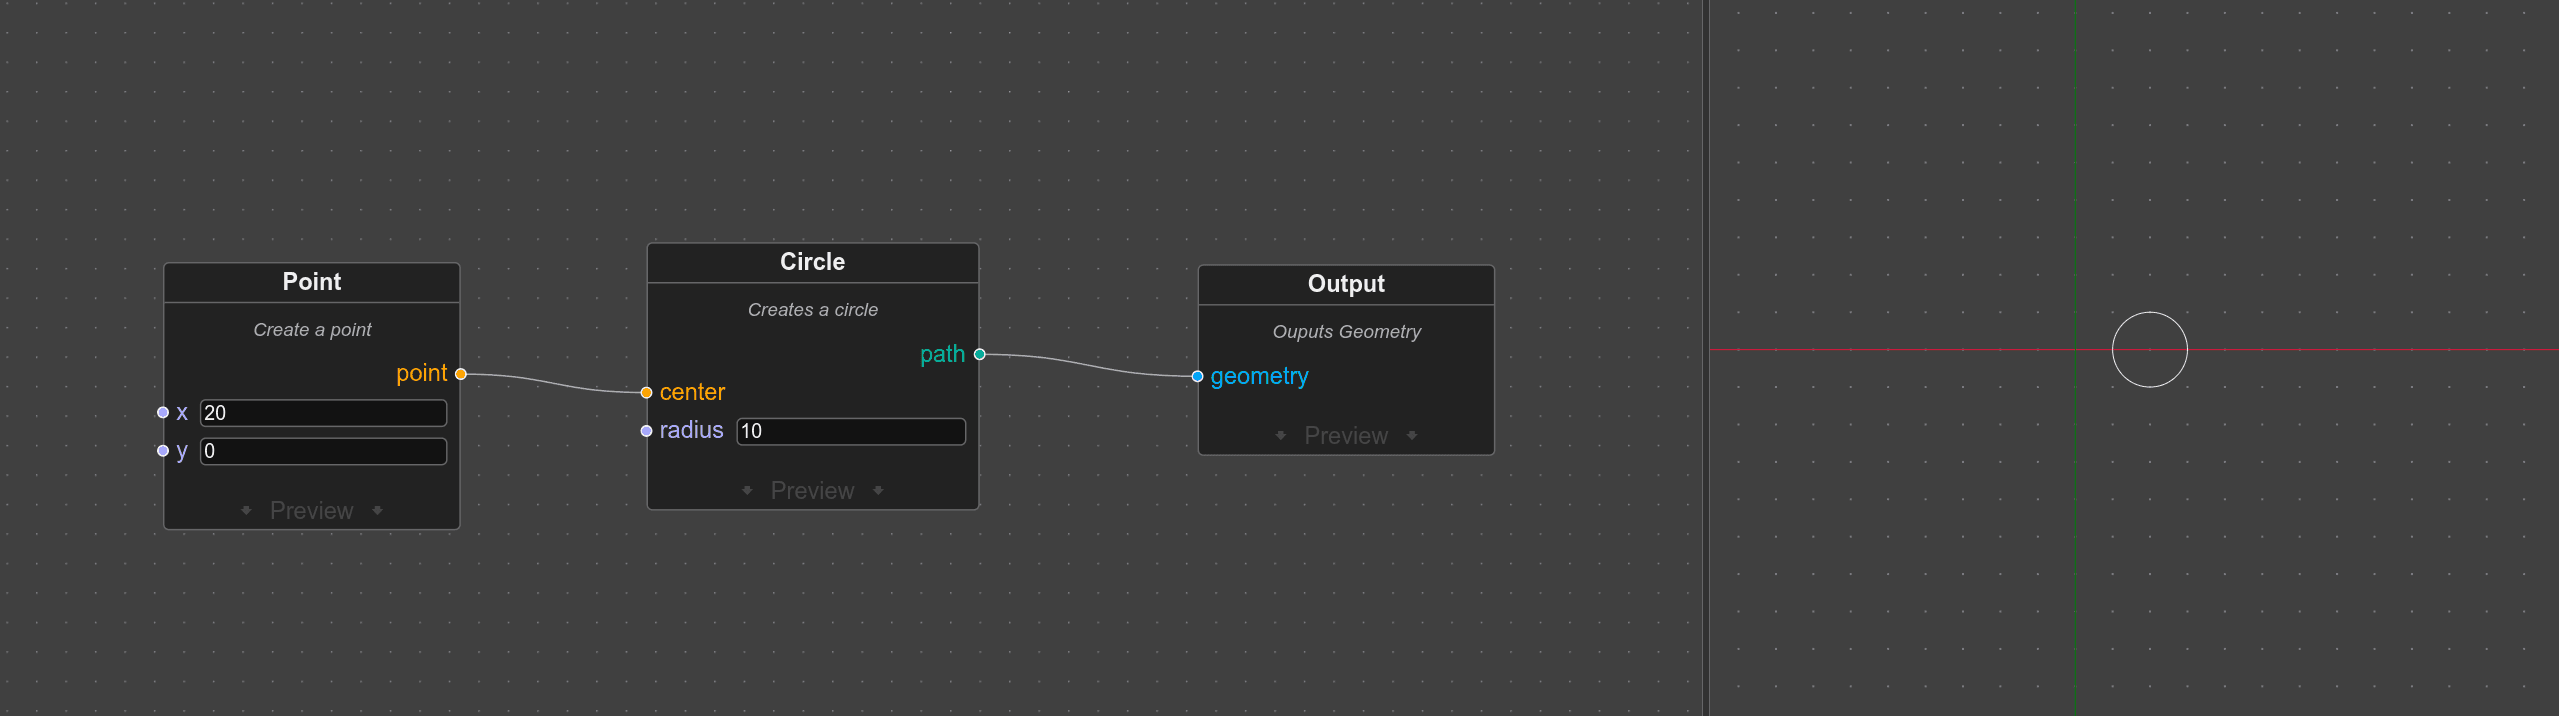
Above is a `Circle` node connected to the output. It draws a circle. Simple right?
By connecting a `Point` node to the circle node, we can change its center point:
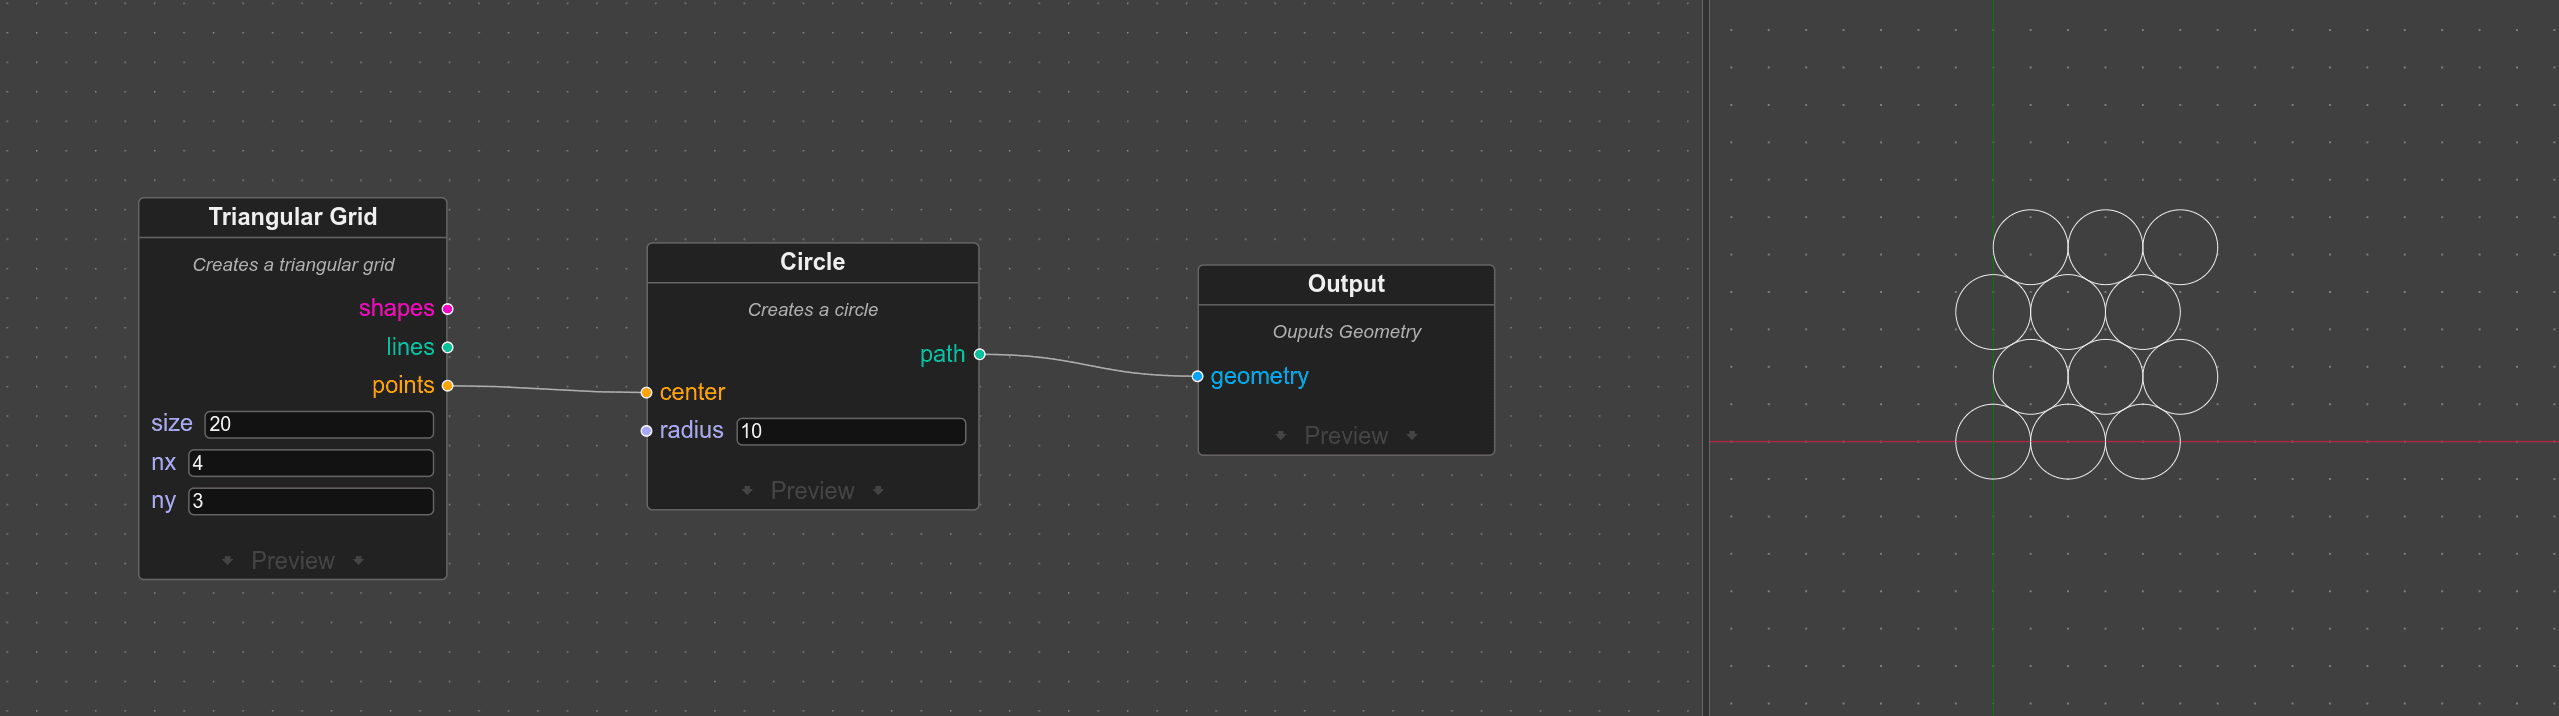
However, by connecting a grid of points to the circle, we instantly get a whole grid of circles. This gets powerful very fast.
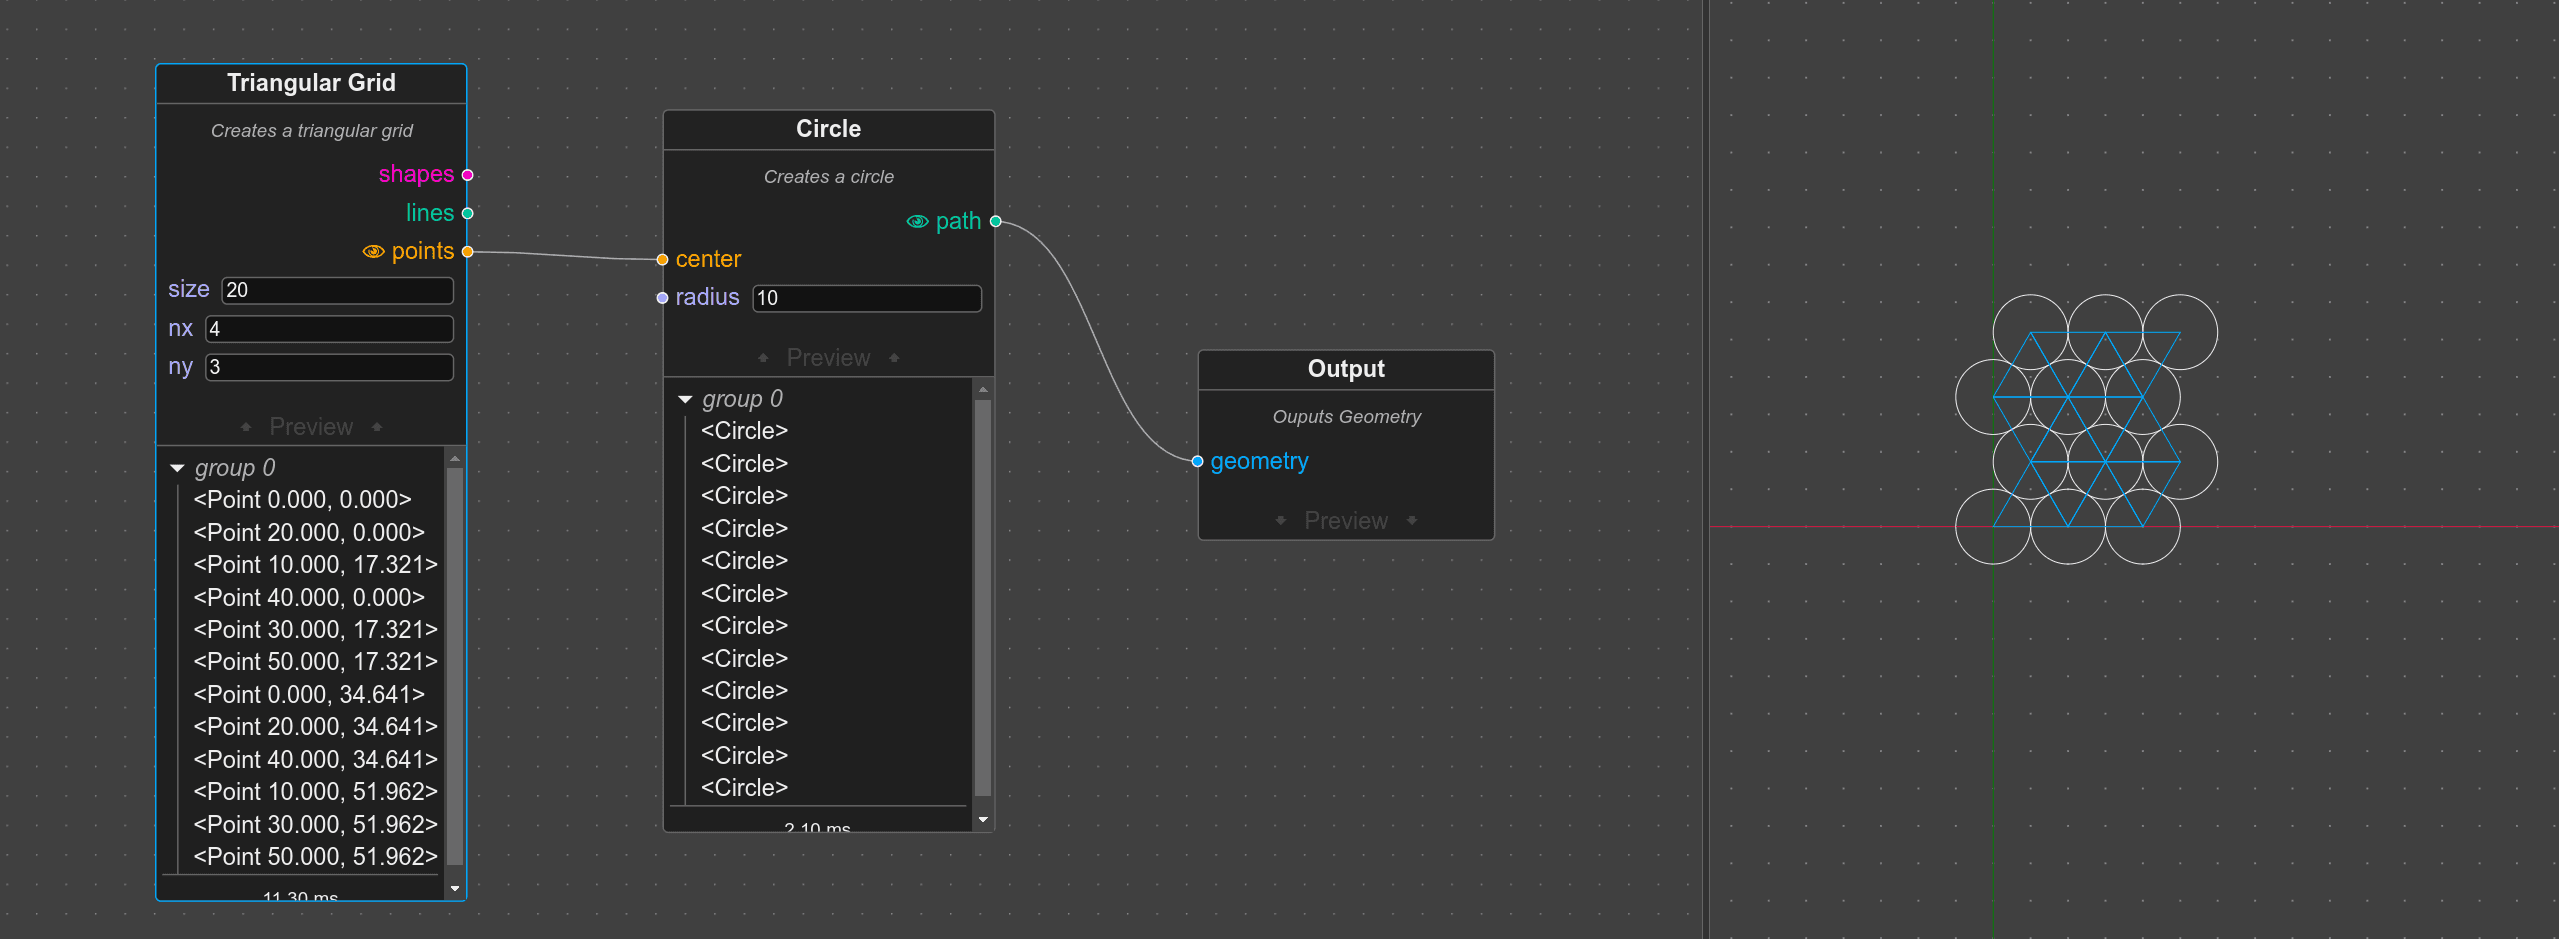
By using the `Preview` panel of a node, you can have a look at what it outputs. Click the output parameter to change the view. Also, when a node is selected, the first output parameter is highlighted on the canvas:
What can I do with...
Points
Points can be created using the Point node. Lots of other nodes use points as input. For example a line has a start and end point, a polyline can be constructed from points and a circle has a center point. Other ways to create points is to use a pattern or to get points from a line or a polyline. In those latter cases, you get a list of points, which you can use to create multiple instances of things.
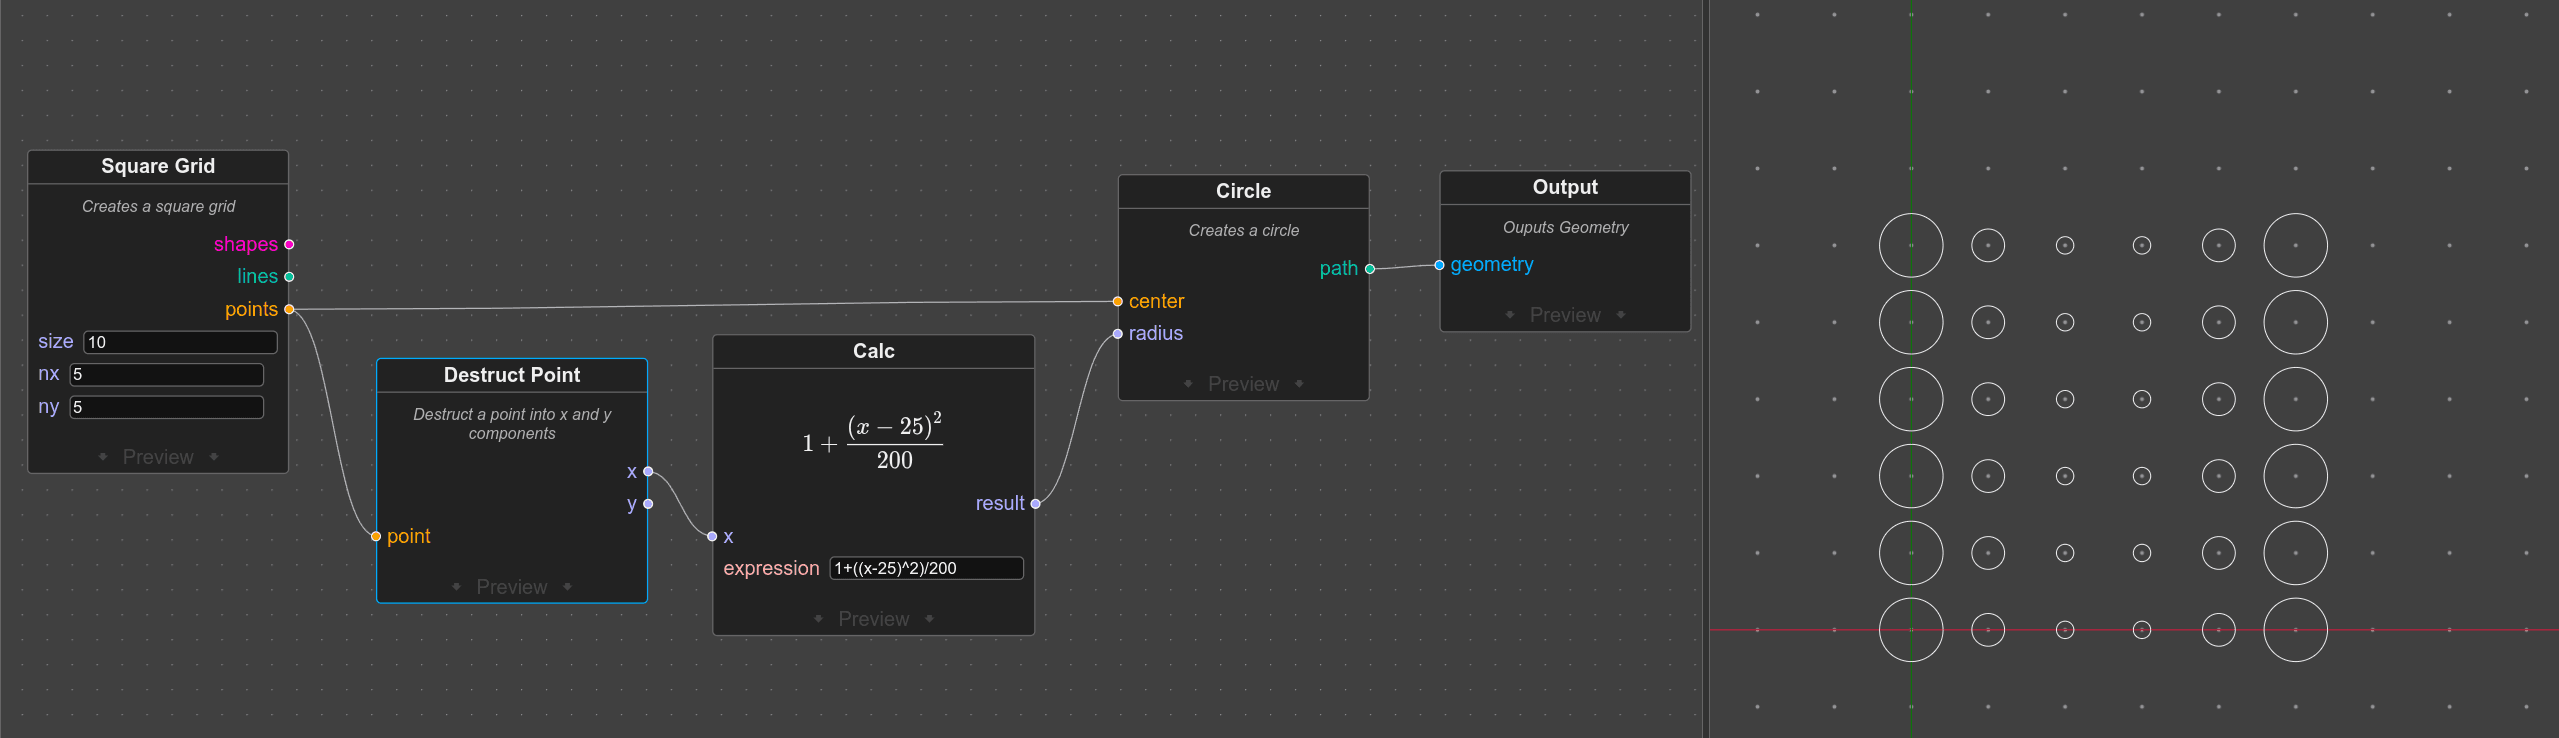
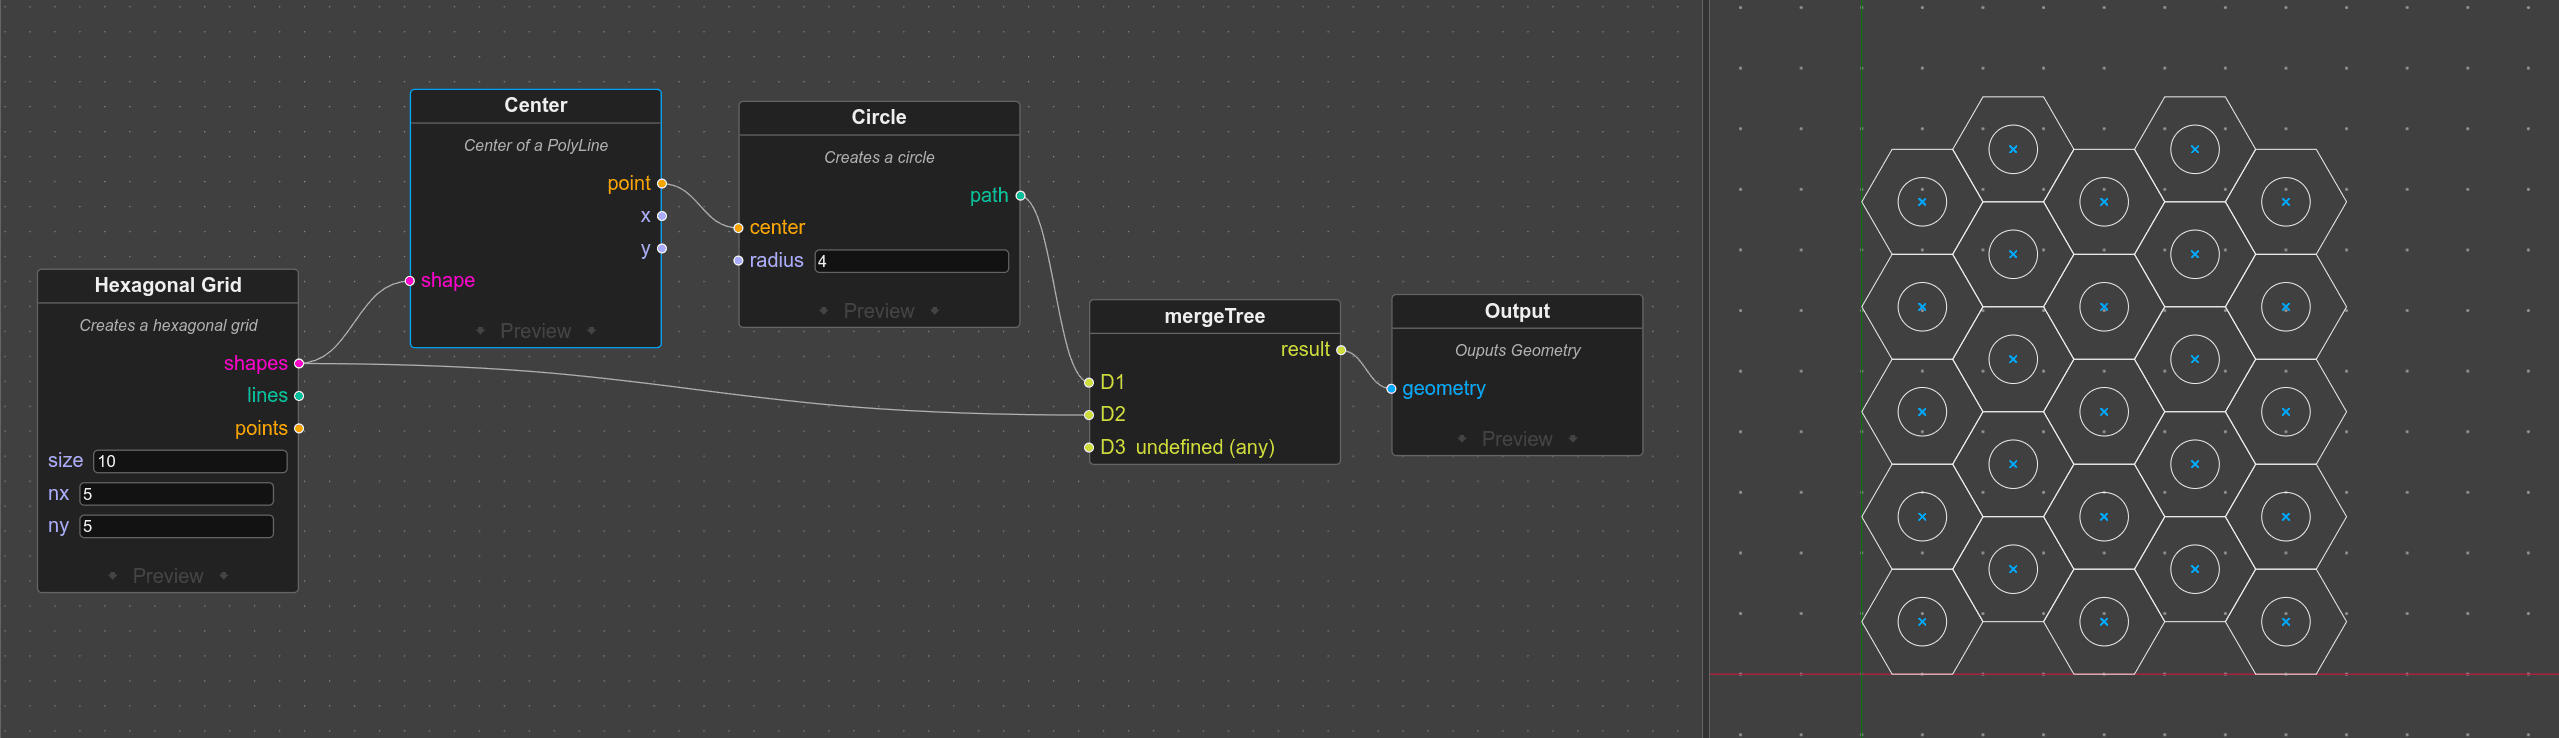
For example, take a look at this setup, where the centers of hexagons are used to center a whole lot of circles. Try connecting the points output of the hexgrid to the circle instead and see what changes. Alternatively, use a point input for the cirle. Look for orangey functions and outputs.
Patterns
Patterns can be a nice start for some tesselation or pattern designs. There are a few options available. You can use the shapes directly, or use the lines or points outputs to place other things on a grid.
Patterns play very nice with the `star pattern` function and the `outline` function. Use a negative outline (inset) to create a nice pattern that can be laser cut:

Math
Use math to calculate things. This is especially useful if you use for example a coordinate of a center to drive an input of another function. You can use this to create variations: